How Much Do You Actually Need to Retire in 2026?
Almost everyone guesses at this number, and most guess wrong in both directions. Here are two honest ways to find yours, real savings benchmarks by age, and a plain explanation of the 4% rule that the number rests on.

The honest answer: it depends, but you can pin it down
When people ask how much they need to retire, they usually want a single magic number. In its 2025 Planning and Progress Study, Northwestern Mutual found Americans put that number at about $1.26 million on average, down from $1.46 million the year before. An average is not your number, though. The truth is that your number is personal, because it depends on what you will spend, how long you will live, and how much guaranteed income you will have coming in. But that does not mean you are stuck guessing. There are two reliable methods that get you very close, and together they give you a range you can actually plan around.
One method works from your income. The other works from your spending. Run both, and where they land tells you most of what you need to know.
Method 1: the income-multiplier method
This is the quick version, and it is the one most people have heard. The investment firm Fidelity publishes a widely used guideline: aim to have about 10 times your final salary saved by the time you retire at 67. Earn $80,000 at the end of your career, and the target is roughly $800,000.
The reason it works as a shortcut is that it quietly assumes Social Security will cover part of your spending and that your savings need to replace the rest. Fidelity also lays out checkpoints along the way, so you can see whether you are on track long before 67:
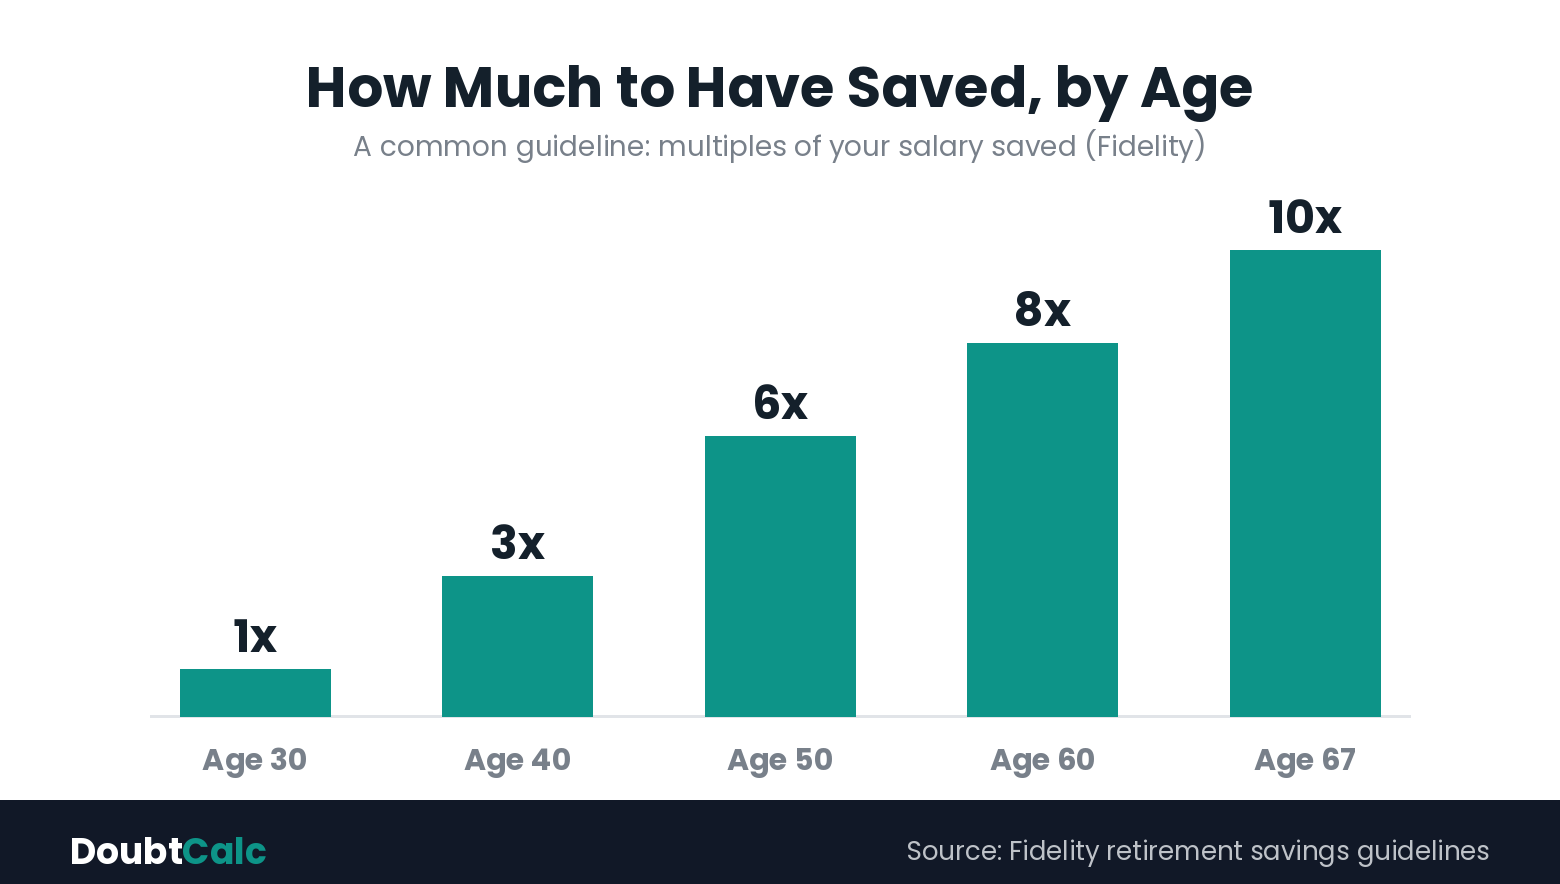
About 1 times your salary saved by age 30, 3 times by 40, 6 times by 50, 8 times by 60, and 10 times by 67. These are guideposts, not laws. Plenty of people are behind at 40 and still retire comfortably, because the later years of compounding do enormous work.
Savings benchmarks by age
Here is the income-multiplier guideline in one picture. Find your age, and you can see roughly where the guideline says you would be. If you are below it, you are not alone, and the gap is closeable.
Method 2: the 25x rule, built from your spending
The income method is fast, but it ignores the most important number in your retirement: what you actually spend. The expense method fixes that. You estimate your annual spending in retirement, subtract the guaranteed income you will receive, and multiply what is left by 25. That is the amount your savings need to cover.
Say you expect to spend $60,000 a year. You expect about $24,000 a year from Social Security. That leaves $36,000 a year your savings must produce. Multiply by 25 and you get $900,000. That is your number under this method, and notice how much smaller it is once Social Security does its share.
Why 25? Because it is the mirror image of the 4% rule, which is the foundation the whole thing rests on.
What the 4% rule actually says
The 4% rule comes from research by financial planner William Bengen and a follow-up known as the Trinity Study. They looked back across decades of market history and asked a simple question: how much could a retiree pull from savings each year without running out over a 30-year retirement?
The answer they landed on was about 4% in the first year, with the dollar amount rising a little each year to keep up with inflation. On a $1 million portfolio, that is roughly $40,000 in year one. Pulling 25 times your annual need is just that math run backward, because 4% is one twenty-fifth of the total.
It is a guideline, not a guarantee. Retire into a bad market, live longer than 30 years, or spend unevenly, and the safe number shifts. Bengen himself has since said the safe rate is probably higher than the original 4 percent in most conditions, which makes the classic 4 percent a conservative floor rather than a ceiling. But as a starting point it has held up well, and it gives you a concrete target instead of a shrug.
Run both, then trust the spending number
The income method is great for a gut check in ten seconds. The expense method is the one to plan around, because it is built from your actual life. If the two numbers are close, you can be confident. If they are far apart, it usually means your spending will be unusually high or unusually low compared to your salary, and the spending number is the honest one.
To see how your current savings grow toward either target, run your numbers through our 401(k) Retirement Calculator. It projects your balance at retirement based on your salary, contributions, employer match, and expected return, so you can see whether you are tracking toward your number or falling behind.
What moves your number up or down
Social Security and pensions lower it, sometimes dramatically, because every dollar of guaranteed income is a dollar your savings do not have to produce.
Healthcare raises it. Medical costs are one of the largest and least predictable expenses in retirement, and they tend to climb faster than general inflation.
When you retire changes it twice over. Retire earlier and your money has to last more years while you have saved for fewer. Work two or three years longer and you save more, compound longer, and shorten the payout period all at once.
Where you live matters too. The same lifestyle can cost wildly different amounts depending on housing and state taxes, which is why two people with identical savings can have very different retirements.
If you are behind, here is how to close the gap
Being behind the benchmark is common, and it is fixable. Raise your savings rate even a few percentage points, because contributions made in your peak earning years compound hard. Capture every dollar of your employer match first, since that is an immediate return you cannot beat anywhere else. If you are 50 or older, use catch-up contributions to push more into your accounts each year.
And do not overlook fees. A single percentage point in investment fees can quietly erase a large share of your savings over a career, money that should have been compounding for you. We broke that math down in how investment fees silently drain your 401(k). Cutting fees is one of the few moves that grows your number without costing you a thing.
The bottom line
You do not need a perfect number. You need a target you can plan around and check against every year. Use the income method for a fast read, build your real number from your spending and the 25x rule, and remember that Social Security shrinks the figure while healthcare and early retirement grow it.
Then make it concrete. Run your savings, contributions, and timeline through the 401(k) Retirement Calculator and see where you land. A number you can see is a number you can hit.
Frequently asked questions
How much money do I need to retire?
Estimate it two ways. The income method suggests about 10 times your final salary by 67. The expense method says about 25 times the yearly spending your savings must cover after Social Security. For a $40,000 annual gap, that is roughly $1 million. Your real number depends on your spending, your guaranteed income, and your health.
What is the 4% rule?
It is a guideline from research by William Bengen and the Trinity Study. You withdraw about 4% of your savings the first year, adjust that amount for inflation each year, and have a strong chance of your money lasting about 30 years. Saving 25 times your annual need is the same idea in reverse.
Does Social Security count toward my number?
Yes, and it lowers it a lot. Your savings only need to cover the gap between your spending and your guaranteed income. Spend $60,000, expect $24,000 from Social Security, and your savings only cover $36,000 a year, which is about $900,000 under the 25x rule.
How much should I have saved by my age?
A common Fidelity guideline: about 1 times salary by 30, 3 times by 40, 6 times by 50, 8 times by 60, and 10 times by 67. They are guideposts, not hard rules, and you can catch up if you are behind.
What if I am behind?
Raise your savings rate, capture the full employer match, use catch-up contributions at 50 and older, cut investment fees, and consider working a couple of extra years. Each one moves your number closer, and together they compound.
Sources and methodology
Savings-by-age benchmarks and the 10x income guideline are from Fidelity's published retirement savings guidelines. The 4% rule and the 25x rule are based on research by financial planner William Bengen and the Trinity Study (Cooley, Hubbard, and Walz). The $1.26 million average is from Northwestern Mutual's 2025 Planning and Progress Study. All figures are general guidelines for education, not personalized advice, and your own number will vary with spending, guaranteed income, health, and market conditions.
Related calculators and articles
401(k) Retirement Calculator
Project your balance at retirement and see if you are on track
Retirement Withdrawal Calculator
Test the 4% rule and see how long your savings last
Compound Interest Calculator
See how your contributions grow over the years
How Investment Fees Silently Drain Your 401(k)
The 1% that can quietly shrink your retirement number
Published by DoubtCalc· When in doubt, calculate.